Console and network logs
For every test it runs, Testmode keeps two things your browser’s developer tools would show: the console messages the page wrote and the network requests it made. When a test fails, these logs often point to the cause, such as a JavaScript error or an API call that returned 500.
Where to find the logs
Section titled “Where to find the logs”-
Open the run from Runs.
-
If the run has several tests, click the test you want.
-
Scroll below Test Steps to the Console and Network tabs.
The tabs appear once the test is Passed or Failed and at least one entry was captured. Logs are collected after the browser closes, so they show up a few seconds after the verdict. They are not shown while a test is still running.
Console: filter by level
Section titled “Console: filter by level”The Console tab shows each message with its level, the message text and the script it came from. A red badge on the tab counts errors.
- Click a level to filter: ALL, ERROR, WARNING, INFO, DEBUG or LOG. Every level except ALL shows how many entries it has.
- Type in Filter… to search message text.
- Long messages are shortened. Click expand to read the whole message.
Start with ERROR. An uncaught exception in the script behind a button often explains why clicking it changed nothing on the page.
Network: find failing requests
Section titled “Network: find failing requests”The Network tab lists the requests the page made, with Status, Method, URL and Type.
- ALL shows every request.
- ERRORS shows requests that got no response or returned a status of
400or above. - 4XX and 5XX narrow to client and server errors.
FAILin the Status column marks a request that got no response at all.
The Network tab has no text search. Use the filters to narrow the list, then scan the URL column.
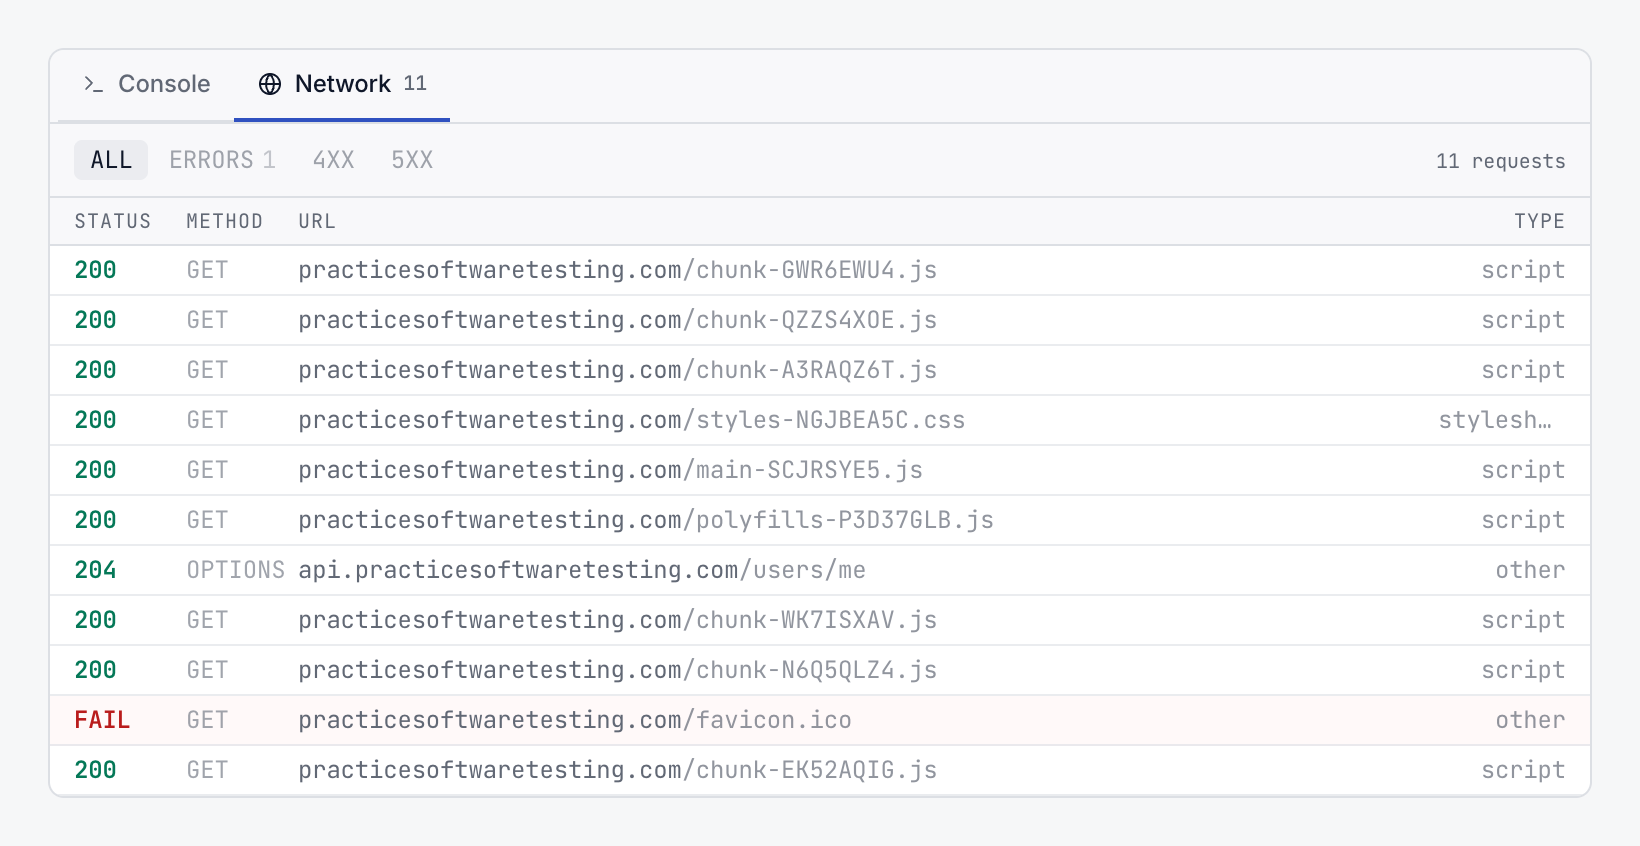
In the capture above, ALL is selected and the only failed request is the favicon, which doesn’t affect the test. When a test fails, select ERRORS and look for a request to the part of your app the test uses. For a test like “Login rejects an unknown email”, an error status on the login request would tell you the rejection came from the server, not from the form.
What is captured
Section titled “What is captured”| Captured | Not captured |
|---|---|
| The requests and console messages the browser reported during the test, including the sign-in when Testmode logs in first | Request and response headers |
| Console messages at every level, with their source script | Request and response bodies |
| Requests that got a response, and requests that failed | Timings and waterfalls |
Logs for explorations
Section titled “Logs for explorations”Explorations capture the same logs. When an exploration finishes, open its Site map tab: the Console and Network tabs appear below the page cards when something was captured. See Start an exploration.
Read logs alongside Test Steps
Section titled “Read logs alongside Test Steps”Logs have no timestamps on screen, so match them to the timeline by what happened:
- Find the action in Test Steps where the page stopped behaving as expected, and look at its screenshot.
- In Network, look for a request to the part of your app that action touches, such as a cart, login or search endpoint, with an error status.
- In Console, look for an error that names the same feature or script.
If the logs are clean and the screenshot shows the page working, the failure may be in the test’s wording rather than in your app. See Troubleshoot failed tests.
Related
Section titled “Related” testmode
Better software quality. No manual testing. Your team knows the software. Testmode does the testing.